EXODUS MANDATE-WV
Goals and Objectives | Christian Education | Resources for teaching| WV News | Articles
Nation’s Report Card 2009
By Karl Priest 2010
The Nation’s Report Card informs the public about the academic achievement of elementary and secondary students in the United States.
The National Assessment of Educational Progress (NAEP) is the largest nationally representative and continuing assessment of what America's students know and can do in various subject areas. Assessments are conducted periodically in mathematics, reading, science, writing, the arts, civics, economics, geography, and U.S. history.
Since NAEP assessments are administered uniformly using the same sets of test booklets across the nation, NAEP results serve as a common metric for all states
The Commissioner of Education Statistics, who heads the National Center for Education Statistics in the U.S. Department of Education, is responsible by law for carrying out the NAEP project.
"Proficient" is one of the three NAEP achievement levels, representing solid academic performance for each grade assessed. Students reaching this level have demonstrated competency over challenging subject matter, including subject-matter knowledge, application of such knowledge to real-world situations, and analytical skills appropriate to the subject matter. The others are "Basic" (partial mastery of prerequisite knowledge and skills that are fundamental for proficient work) and "Advanced" (superior performance).
READING REPORT CARD
Reading report card for grade four (2010 report of 2009 results). Click on the state image to quickly see that West Virginia fourth grade students are lower than the national average
in reading and only had better scores than eight states/jurisdictions.
I call this the “quick-click” map.
It opens the State Snapshot Report.
The Nation’s Report Card also provides an eye-opening interactive map. Hover the mouse pointer over each state to see which is higher or lower than the national average. Click on the West Virginia state outline and then you can compare other states to West Virginia by hovering over those states.
Reading report for grade eight quick-click map (2010 report of 2009 results). Click on the state image and
the State Snapshot Report
will show you that West Virginia eighth graders
are lower than the national average in reading and only had better scores than two states/jurisdictions.
It looks like the longer students are in school the worse it gets.
Grade 8 reading scores interactive map (See the reading section for an explanation.)
MATH REPORT CARD
The quick-click map brings up the State Snapshot Report for each state clicked on. Click on the state image to quickly see that West Virginia fourth grade students are lower than the national average in math and only had better scores than six states/jurisdictions. Fourth grade math scores quick-click map
Hover the mouse pointer over each state, on the interactive map, to see which state is higher or lower than the national average. Click on the West Virginia state outline and then you can compare other states to West Virginia by hovering over those states. Fourth grade math scores interactive map
Click on the state image in the eighth grade quick-click map to see that West Virginia eighth grade students are lower than the national average in math and only had better scores than two states/jurisdictions. It looks like the longer students are in school the worse it gets. Eighth grade math scores quick-click map
Eighth grade math scores interactive map
(See the
the fourth grade above
for an explanation.)
SCIENCE REPORT CARD
In 2009 the average science score for West Virginia fourth graders was higher than only nine other states/jurisdictions. The percentage of students in West Virginia who performed at or above the NAEP Proficient level was 28 percent in 2009. This percentage was smaller than the nation (32 percent). The complete report is the State Snapshot Report which is obtained from the fourth grade science scores quick-click map.
Fourth grade science interactive map (See the reading section for an explanation.)
In 2009 the average science score for West Virginia eighth graders was higher than only seven other states/jurisdictions. The percentage of students in West Virginia who performed at or above the NAEP Proficient level was 22 percent in 2009. This percentage was smaller than the nation (29 percent). The complete report is the State Snapshot Report which is obtained from the eighth grade science scores quick-click map.
Eighth grade science interactive map (See the reading section for an explanation.)
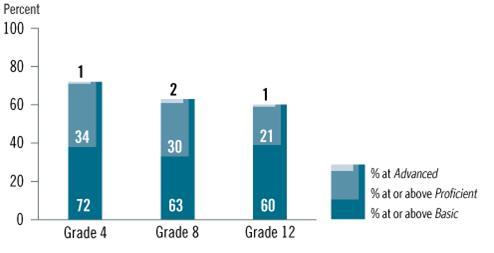
According to this graph, the longer kids stay in public schools the dumber they get. Could it be because they get more evolution crammed into the curriculum?
Achievement-level results in NAEP science at grades 4, 8, and 12: 2009
SOURCE: U.S. Department of Education, Institute of Education Sciences, National Center for Education Statistics, National Assessment of Educational Progress (NAEP), 2009 Science Assessment.
----------------------------------------------
Private school information
Homeschool information
West Virginia testing news can be found in November 19, June 14, April 30, March 24, and January 15 entries at 2010 West Virginia School News.
Also see my articles “Down the Drain,” “Public School Systems are Neglecting Black Students”, and “The Public School System is Broken.” You will need to scroll down to find these items.
|